Exploring harmonics
A square wave is made of harmonics, and almost everything that happens to it in real equipment happens to those harmonics: some are removed, some shifted in time, some made louder or quieter, and sometimes new ones appear. This page explores them through one question.
Feed a square wave into an audio chain (a converter, an EQ, an amplifier) and look at what comes out on a scope. It’s almost never square. There’s ripple at the edges, the flat tops lean or sag, the corners are rounded, and sometimes the whole shape looks skewed. Is something broken?
Usually not. A square wave is one of the most demanding signals there is, and each part of a normal, healthy chain changes it in its own recognisable way. This page takes those changes one at a time, so you can see what causes each one, and then puts them together. By the end, a scope trace should read like a list of clues.
The page uses three earlier ones:
- The Fourier transform, for harmonics.
- Designing FIR filters and IIR filters, for filters and their responses.
- Modulation, part 1, for all-pass filters.
Two terms first:
- A linear stage (any filter, an EQ, a cable) obeys a simple rule: double the input and the output doubles; add two inputs and the outputs add. Every linear stage does the same thing to a sine wave: it comes out as a sine of the same frequency, maybe bigger or smaller, maybe shifted in time. Nothing else.
- A non-linear stage (clipping, saturation, an amplifier pushed too hard) breaks that rule.
The figures work as if the signal had always been running, so what you see is the steady state, and the signals are as clean as a good signal generator’s: their edges take about 7 µs.
1 · A square wave is a sum of sine waves
Section titled “1 · A square wave is a sum of sine waves”A square wave of frequency is a sum of sine waves at , , , , and so on, the odd harmonics, each one weaker in proportion: the 3rd is a third of the fundamental, the 5th a fifth. Add them up one at a time and the shape gets squarer, and its edges sharper.
Top: the first harmonics added up (blue), against the whole wave (dashed), at 100 Hz. Bottom: each harmonic’s level. Choose other signals: a sawtooth has every harmonic, falling as 1/k; a triangle only the odd ones, falling much faster, as 1/k²; a pulse has every harmonic, with some missing in a pattern set by its width.
With 9 harmonics (5 of them non-zero), each edge overshoots by 8.5% of the jump and ripples. Add more, up to 199 (100 of them non-zero): the ripple gets faster and squeezes into the edges, but the overshoot doesn’t go away. It settles at about 9%.
That 9% is the Gibbs phenomenon, met before on the FIR design page. Leaving out every harmonic above some frequency always leaves an overshoot of about 9% of the jump, however high that frequency is. Only the ripple’s speed changes: it rings at about the frequency where the harmonics stop.
This is the key to everything that follows. Whatever a chain does to a square wave, it does by changing these harmonics’ levels and timing. And a square wave’s sharp edges need harmonics far above the audio band.
2 · Band-limiting: the ripple
Section titled “2 · Band-limiting: the ripple”Every real system stops passing frequencies somewhere. An ADC needs a low-pass filter to prevent aliasing, a DAC needs one to remove the copies of the spectrum above half its sample rate, and amplifiers and cables run out of bandwidth too. Each removes the square wave’s upper harmonics. How the ripple looks depends on what kind of filter does it:
- An ideal (brick-wall) filter keeps everything below the cut-off untouched and removes everything above it. That’s exactly section 1’s sum of harmonics.
- A linear-phase filter, the kind inside nearly every modern ADC and DAC, is a steep digital FIR filter. It delays every frequency by the same time, and rings symmetrically: before each edge as well as after.
- An analogue filter (here, Butterworths of order 2, 4 and 8, and a single RC) can only respond after its input arrives, so it rings only after each edge. Steeper filters ring more.
Top: two periods before (dashed) and after (blue) the filter. Middle: a close-up of the rising edge. Bottom: the filter’s gain, with an orange dot at each harmonic of the signal.
A 1 kHz square wave through a linear-phase filter cutting off at 20 kHz, as in a converter: the edge overshoots by 8.3%, and a ripple of 7.6% appears before it, ringing at 21.0 kHz. Through an analogue filter with the same cut-off there’s no ripple before the edge at all. A 2nd-order Butterworth overshoots 4.1%, a 4th-order 10.2%, and an 8th-order 15.5%. A single RC (resistor and capacitor) doesn’t overshoot at all: it just rounds the edge off, rising in 19.0 µs from 10% to 90%.
That’s the first clue: ripple on both sides of an edge comes from a digital, linear-phase filter, like an ADC’s or a DAC’s. Ripple only after the edge comes from an analogue filter. Some DACs offer a choice of “sharp”, “slow” or “minimum-phase” filters for exactly this reason: the minimum-phase kind moves all the ringing after the edge.
Is the ripple a fault? No: it’s what a square wave looks like with the inaudible harmonics above 20 kHz taken away. Remove the same harmonics from music, and nothing audible changes.
3 · Phase on its own changes the shape
Section titled “3 · Phase on its own changes the shape”Section 2’s filters change the harmonics’ levels and their timing. What does timing alone do? An all-pass filter leaves every harmonic’s level exactly as it was, and only shifts each one in time by a different amount: a frequency-dependent phase shift.
The same harmonics, at the same levels, with only their phases changed, on a 200 Hz signal. Top: before (dashed) and after (blue). Bottom: each harmonic’s level, before and after: always the same.
A delay that’s the same time for every harmonic just moves the wave along: its shape is unchanged. Everything else changes the shape completely, without changing any harmonic’s level by more than 0.00 dB. A first-order all-pass at 800 Hz turns the square wave into spiky peaks reaching 2.86, almost three times its original height; a 90° shift for every harmonic makes 4.47; random phases, 1.86. Listen: they sound nearly the same.
So a wave’s shape depends on its harmonics’ phases, but our ears mostly hear their levels. A skewed or spiky shape on a scope doesn’t mean something sounds wrong. It means a phase shift that varies with frequency, which almost every analogue circuit has.
The peaks matter in another way, though: the same signal now needs almost three times the headroom. An amplifier with room for the original square wave could clip the phase-shifted one, which is section 6’s subject.
4 · The tilt: AC coupling
Section titled “4 · The tilt: AC coupling”Most audio stages block DC (any steady voltage) with a capacitor in series with the signal: AC coupling. That capacitor, with the resistance after it, is a first-order high-pass filter, usually with its corner somewhere between 1 and 20 Hz: far below anything audible.
A square wave’s flat top is the one part of it that’s like DC: a constant level, held for half a period. A high-pass filter can’t hold a constant level. It lets it decay back towards zero, so the top droops, the bottom rises, and the square wave tilts.
A square wave through a first-order high-pass filter (a coupling capacitor). Top: before (dashed) and after (blue). Bottom: the filter’s gain, with the harmonics as orange dots.
At 50 Hz, with the corner at 10 Hz, the top droops by 21.4% of the jump. The fundamental is shifted forward by 11.3°, and each edge now jumps above the old top, to 1.30. Lower the corner to 1 Hz and the droop is just 2.1%. The same 10 Hz corner tilts a 20 Hz square wave by 54.6%, and a 1 kHz one by only 1.1%.
So a tilt means low frequencies are being changed: by a high-pass (AC coupling, a bass cut, a speaker’s natural roll-off) or by a bass EQ. The lower the square wave’s frequency, the worse it looks. That’s why audio equipment is often tested with square waves at a few different frequencies: the tilt at 50 Hz shows the bass, the edges at 10 kHz show the treble.
5 · EQ
Section titled “5 · EQ”An EQ stage boosts or cuts a band of frequencies. A shelf changes everything above (or below) a frequency; a peak changes a band around one. Analogue EQs, and the digital “biquad” EQs copied from them (see the IIR design page), are minimum-phase: their phase shifts come with their level changes. A linear-phase EQ changes the same levels, with no phase shift at all, at the price of a delay and ringing before edges.
A square wave through an EQ. Top: before (dashed) and after (blue). Bottom: the EQ’s gain, with the harmonics as orange dots.
A bass shelf, +6 dB at 200 Hz, on a 200 Hz square wave: built as an analogue EQ, the tops lean steeply, rising by 54.7% of the jump across each half-period, to a peak of 1.98. The same boost built as a linear-phase EQ leaves the tops flat (the levels changed, but there’s no phase shift), and the peak is only 1.52. A treble shelf, +6 dB at 2 kHz: the analogue one makes a spike after every edge, reaching 2.80; the linear-phase one spikes on both sides, with 48.6% of ripple before each edge.
That’s the “skewed” look: a minimum-phase EQ shifts the harmonics near its frequency in phase as well as level, so the shape leans or twists. The same EQ curve built with linear phase keeps the shape symmetric, but smears it on both sides of each edge.
6 · Non-linear distortion
Section titled “6 · Non-linear distortion”Everything so far has been linear. A linear stage can only change the levels and timing of frequencies already there: it can never create a new frequency. That’s the test for a non-linear stage, which always does.
The figure feeds a signal through a transfer curve: for every input level, the output level. A straight line at 45° is a perfect stage. The usual faults:
- Hard clipping: the output can’t go beyond the supply rails, so peaks are cut flat.
- Soft saturation: the curve bends gradually, as valves, transformers and tape do.
- Asymmetric saturation: one side bends sooner than the other, as a single transistor stage does.
- Crossover distortion: a dead band around zero, from a class-B output stage whose two halves don’t quite meet.
Top: the transfer curve (dashed: perfect), with the input’s range shaded. Middle: a 1 kHz input (dashed) and the output (blue). Bottom: harmonic levels: input (grey), output (blue), new ones (orange). The THD (total harmonic distortion) is the power of all the harmonics the stage added, against the fundamental’s, as a percentage of amplitude.
A sine driven 1.5 times past the clipping point: THD 15.34%, all odd harmonics. Soft saturation at the same drive, 12.24%; at a third of it, 1.96%. Asymmetric saturation makes even harmonics too (the 2nd is 20.6 dB below the fundamental) and shifts the average level by 0.093: a lopsided curve treats the two halves of the wave differently. Crossover distortion is worst at low levels: 6.27% at full drive, 22.36% at 0.3.
Now try a square wave. Clip it, and no new frequencies appear: a square wave already has every odd harmonic, and symmetric distortion only changes their levels. Only asymmetric distortion adds new ones, at −34.6 dB.
So to find distortion, test with a sine, not a square wave. Anything at a frequency the sine doesn’t have is distortion; a square wave hides most of it.
7 · Slew-rate limiting
Section titled “7 · Slew-rate limiting”An amplifier’s output can only change so fast: its slew rate, often given in volts per microsecond. A square wave’s edges ask for an instant change, so a slew-limited amplifier turns them into straight ramps, however good its frequency response looks on paper. For a sine, the steepest slope is × its peak, so fast, large sines hit the limit first: their peaks and troughs turn into triangles.
The signal’s peak is 1, so a full swing is 2. Top: input (dashed) and the slew-limited output (blue). Bottom: harmonics: input (grey), output (blue), new ones (orange).
A 5 kHz sine has a steepest slope of 0.031 per µs. With a slew rate of 0.05 per µs, it passes untouched. At 0.03 per µs it’s only just too slow, and the THD is 0.62%. At 0.02 the peaks have become ramps, and the THD is 11.28%. A square wave’s edges become straight lines, taking 2 ÷ the slew rate to cross.
Straight-line edges, the same steepness however big the jump, are the clue. A filter’s edges are curved, and their steepness grows with the size of the jump.
8 · The whole chain
Section titled “8 · The whole chain”Now put it together: a converter’s linear-phase filter, an EQ, an amplifier’s AC coupling, and the amplifier itself, with a slew limit and supply rails. Every stage can be switched on and off, and every stage has its settings, as in the figures above. The list under the figure reads the result the way you’d read a scope: from what’s measured, not from which boxes are ticked.
The converter’s filter has three versions:
- Standard roll-off: linear phase, flat to the frequency you set and falling to nothing 20% above it. Most converters’ filters are like this.
- Steep roll-off: the same, but falling to nothing only 5% above it.
- Minimum phase: a steep analogue-style filter (an eighth-order Butterworth), as in the “minimum phase” setting some DACs offer. It rings only after each edge.
Top: what goes in (dashed) and what comes out (blue). Middle: a close-up of the rising edge. Bottom: the gain of the filters and EQ together, with the signal’s harmonics as dots. Below: the measurements, and what they suggest. Start from resets every control to one of three settings.
From the starting settings (converter at 20 kHz, a bass shelf of +6 dB at 100 Hz, AC coupling at 10 Hz), a 1 kHz square wave comes out with 8.9% of ripple before each edge and 11.2% overshoot after, and tops that rise by 4.2%. Turn off the converter’s filter, and the ripple before the edge goes (1.3%), leaving the EQ’s overshoot after (3.0%). Switch the converter to a steep roll-off, and the ripple halfway along the top more than doubles, from 0.8% to 1.8%. Turn on the amplifier’s slew limit, and the edges slow from 20.8 µs to 31.9 µs, but a square wave shows no new frequencies, and the list says why.
A real scope trace
Section titled “A real scope trace”Here’s a real trace. A signal generator made a 1 kHz square wave, which went into an amplifier whose input goes straight to an ADC (everything after that is digital, until the power stage), and the scope measured the amplifier’s output at its speaker terminals. The amplifier’s EQ was set flat.
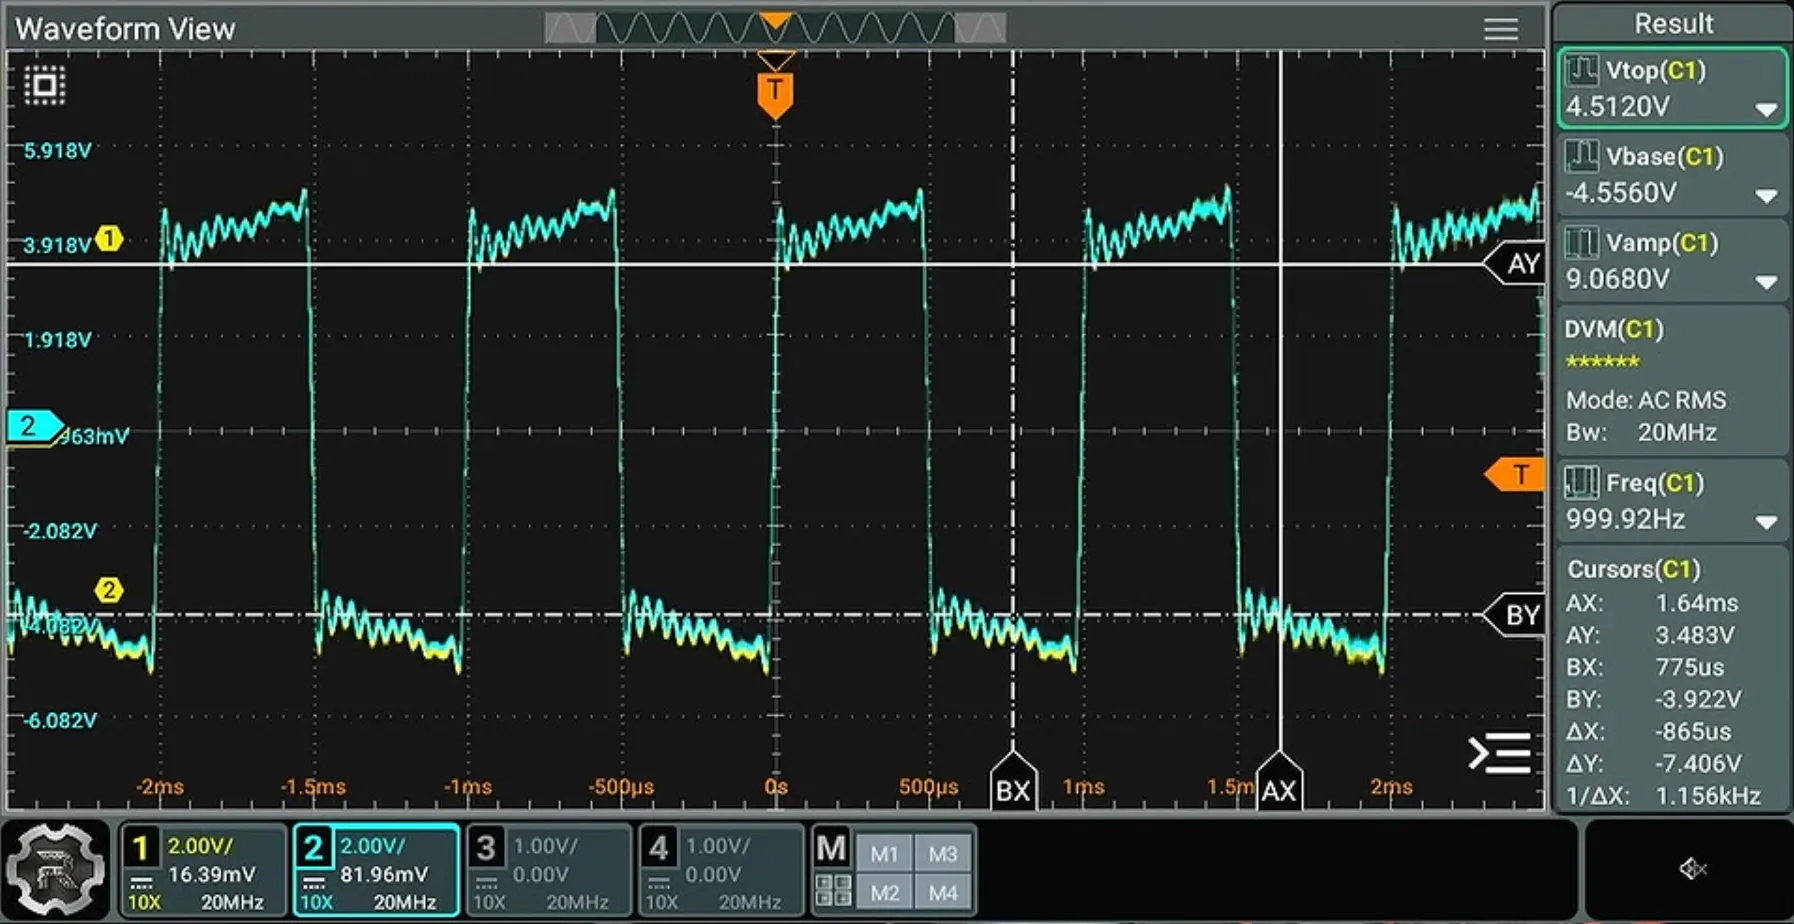
The wave swings about ±4.5 V, and it shows two things:
- Ripple all the way along each top and bottom, not just after the edges: about 10 to 12 ripples in each half-period, so at roughly 20 to 24 kHz, and still about ±0.15 V halfway along.
- Tops that rise, and bottoms that fall: each top climbs by about 1 V between one edge and the next.
Choose close to the scope trace in the figure. The converter’s filter is set steep, flat to 21.5 kHz; a 1 kHz square wave’s harmonics are its odd multiples, so the 21st harmonic (21 kHz) gets through untouched and the 23rd (23 kHz) is removed. A series of harmonics that stops dead like that leaves a ripple near the frequency where it stops, and it hardly dies away: halfway along the top it’s still 1.6% of the jump, about ±0.15 V on a 9 V jump, as on the scope. Switch the filter to a standard roll-off and it halves (0.8%): the highest harmonics fade out gradually instead of stopping, and the ripple dies away faster. The signal generator’s square wave had harmonics far above 20 kHz; the ADC’s filter is what stopped them.
The rising tops aren’t AC coupling: that makes tops droop, not rise. They’re the shape of a bass boost (or, much the same thing, a gentle treble cut). The preset uses a bass shelf of +6 dB at 200 Hz, and the tops rise by 11.0%, about 1 V of the 9 V jump, as on the scope. Switch the EQ off and the tops go flat, while the ripple stays.
So with the EQ flat, something else is still lifting the bass. In an amplifier that works digitally, the likeliest is more processing: a loudness setting (which boosts the bass, and often the treble, at low volumes, because our ears hear less of both when it’s quiet), a “bass enhancement”, or a speaker correction. The trace alone can’t say which, but a sine sweep can: play sine waves from 20 Hz to 2 kHz and compare their levels at the speaker terminals, with each setting on and off.
So, for a square wave through audio equipment:
| What you see | What usually causes it |
|---|---|
| Ripple on both sides of each edge, at about 20 kHz | The converter’s digital, linear-phase filter: normal. |
| Ringing after each edge only | An analogue low-pass or an EQ. |
| Rounded edges, no ringing | A gentle (first-order) low-pass, or limited bandwidth. |
| Tops that droop | AC coupling or a bass cut: worse at low frequencies. |
| Tops that lean or rise, a skewed shape | A bass EQ, or other phase shifts at low frequencies. |
| Ripple that carries on along the whole top | A steep filter cutting off between two harmonics. |
| Edges as straight ramps | Slew-rate limiting in an amplifier. |
| Flattened peaks | Clipping: check with a sine for new frequencies. |
Summary
Section titled “Summary”- A square wave is a sum of odd harmonics. Remove the upper ones, and the edges ripple with an overshoot of about 9% (the Gibbs phenomenon).
- Linear-phase filters, as in converters, ring both before and after each edge. Analogue filters ring only after it.
- Phase alone can change a wave’s shape dramatically, and its peak level, while leaving every harmonic’s level, and mostly the sound, unchanged.
- AC coupling (a high-pass) makes flat tops droop. EQ leans and skews the shape through its phase shifts as well as its level changes.
- Linear stages never create new frequencies; non-linear ones always do. Test for distortion with a sine, not a square wave.
- Slew-rate limiting turns edges into straight ramps.
Further reading
Section titled “Further reading”- J. W. Gibbs, letter in Nature 59 (1899): the overshoot that bears his name (described earlier, by Henry Wilbraham, in 1848).
- D. Self, Audio Power Amplifier Design, 6th edition, Focal Press (2013): slew rate, crossover and other distortions, and how to measure them.
- J. G. Proakis and D. G. Manolakis, Digital Signal Processing, 4th edition, Pearson (2007): linear phase, minimum phase and all-pass filters.